


Online Labor Demand Dips 44,400 in February
Press release from the issuing company
Thursday, March 7th, 2013
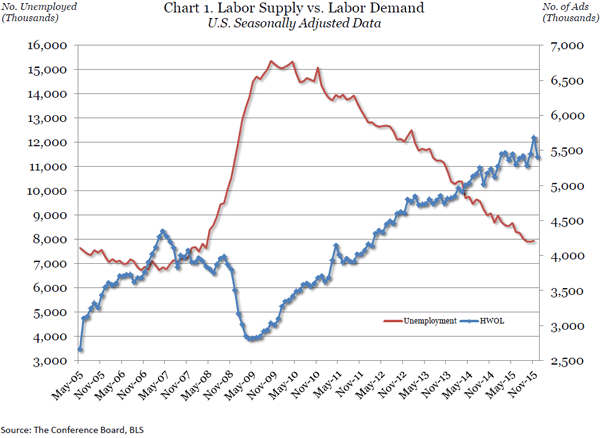
Online advertised vacancies dipped 44,400 in February to 5,056,700 in The Conference Board Help Wanted OnLine (HWOL) Data Series released today. The decline follows strong gains in December (215,000) and January (126,000). The Supply/Demand rate stands at 2.4 unemployed for every vacancy. In January, there were 7.2 million more unemployed than the number of advertised vacancies, down from 11.9 million at the end of the recession in June 2009.
“It’s a positive sign that employers are advertising to fill vacancies and workers are looking to find better jobs,” said June Shelp, Vice President at The Conference Board. “Indeed, with over five million online advertised vacancies, there is quite a bit of churn in the labor market as employers and job-seekers show their confidence in economic conditions.”
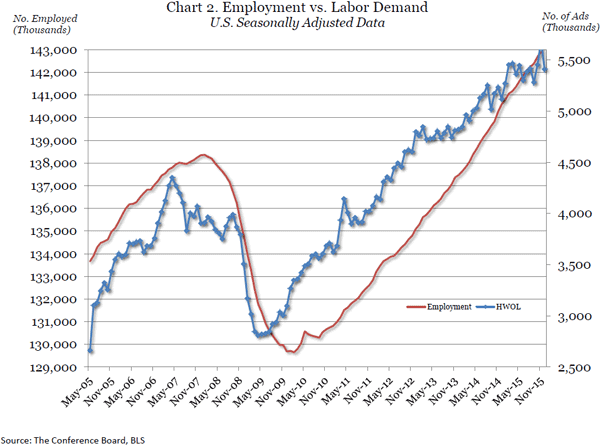
The recent trend for the U.S. is up (See Chart 1). Among the largest 20 States, 15 States are trending up, 5 are flat, and none are trending down. (See Table A, page 2).
REGIONAL AND STATE HIGHLIGHTS
- The recent trend is positive for 15 of the largest 20 States
February Changes for States
In February, online labor demand dipped in 40 of the 50 States in the U.S. (Table 3). Forty-four of the 50 States are above February 2012’s levels; the States that have declined since last year are Missouri, Pennsylvania, Arkansas, Vermont, West Virginia, and South Dakota.
Online labor demand in the Midwest dropped 25,400 in February. Illinois experienced the largest decrease, 10,000. Other states that declined include Michigan, by 9,800; Minnesota, by 2,300, Missouri, by1,500; and Ohio, by 500. Wisconsin gained 2,100, reached its series high of 109,000. Among the smaller Midwest States in February, Indiana fell 2,800, North Dakota lost 1,100, and Kansas dropped 900.
In the South, online labor demand fell 18,300 in February (Table A) with Georgia experiencing the largest decrease (-8,400). Virginia was down 3,300; Texas, down 2,900; and North Carolina, down 1,700. Florida was up 300 while Maryland gained 100 and reached its series high, 121,500. Among the smaller States, South Carolina increased by 700 and Arkansas increased by 100 while Louisiana lost 1,100 and Tennessee lost 100.
Online labor demand in the West decreased by 18,000 in February. Colorado led the decline with a decrease of 5,800. California, the region’s largest State, fell 5,200. Arizona dropped 3,800, and Washington declined by 1,600. Among the smaller States in February, Nevada fell 1,300, Utah fell 300, and Oregon gained 1,800 (Table 3).
Online labor demand in the Northeast dipped 9,000 in February with Massachusetts down 2,500 and New Jersey down 2,100. Pennsylvania dropped 900. New York inched up 800 and reached its series high of 296,000. Among the smaller States in the Northeast, February labor demand decreased by 4,500 in Connecticut, 800 in Maine, 800 in New Hampshire, and 500 in Rhode Island (Table 3).
The Supply/Demand rates for the States are for December 2012, the latest month available for state unemployment data. The number of advertised vacancies exceeded the number of unemployed only in North Dakota, where the Supply/Demand rate was 0.63. The State with the highest Supply/Demand rate is Mississippi (4.81), where there were nearly five unemployed workers for every online advertised vacancy. Note that the Supply/Demand rate only provides a measure of relative tightness of the individual State labor markets and does not suggest that the occupations of the unemployed directly align with the occupations of the advertised vacancies.
METRO AREA HIGHLIGHTS
- In February, 32 of the 52 largest metro areas posted decreases in labor demand with 19 increasing and one (Salt Lake City) remaining constant
- 23 of the largest metro areas have supply/demand rates below 2, indicating that there are fewer than two unemployed workers for every online advertised vacancy
Metro Area Changes
In February, 14 of the 20 largest MSAs and 32 of the 52 metropolitan areas for which data are reported separately posted decreases in the number of advertised vacancies (Table B and Table 5). In the largest metro areas in February, Philadelphia in the Northeast posted a gain of 1,400 advertised vacancies. The other large metro areas posting February gains included: New York in the Northeast, up 800; Cleveland in the Midwest, up 400; Baltimore, up 1,400, and Houston, up 1,100, in the South; and Los Angeles in the West, up 1,000 (Table B).
Twenty-three of the reported MSAs had Supply/Demand rates in December 2012 (the latest available data for unemployment) lower than 2, indicating there are fewer than two unemployed for every advertised vacancy (See Table 6). Washington, DC continues to have the most favorable Supply/Demand rate (1.04) with about one advertised vacancy for every unemployed worker. Minneapolis-St. Paul (1.20), Oklahoma City (1.21), Salt Lake City (1.26), Boston (1.37), Columbus (1.40), San Jose (1.42), Austin (1.46), and Seattle-Tacoma (1.47) had the next lowest Supply/Demand rates.
Metro areas in which the number of unemployed is substantially above the number of online advertised vacancies include Riverside, CA, with nearly seven unemployed workers for every advertised vacancy (6.83); Las Vegas (3.86); Sacramento (3.60); and Los Angeles (3.50).
In just over three and a half years since the end of the recession, a number of the large metro areas have posted gains in labor demand above 100 percent. The most notable of these are Columbus (up 153 percent), Nashville (up 147 percent), Cleveland (up 146 percent), Charlotte (up 144 percent), Minneapolis-St. Paul (up 142 percent), Denver (up 138 percent), Detroit (up 136 percent), Birmingham (up 134 percent), Milwaukee (up 133 percent), and Portland (up 121 percent).
OCCUPATIONAL HIGHLIGHTS
- Note: Occupational data now based on 2010 SOC standards
- 12 of the 22 major occupational groups in the Standard Occupational Classifications (SOC) rose in February (Table C and Table 7)
- Office and Administrative Support occupations were up 20,100 while Sales and Related occupations posted a decline of 23,700 in February
Occupational Changes for the Month of February
In February, among the largest occupational groups, Office and Administrative Supportoccupations increased 20,100 to 550,300, largely due to higher demand for First-Line Supervisors/Managers of Office and Administrative Support Workers and Executive Secretaries and Administrative Assistants. Labor demand for Transportation and Material Moving was up 10,400 to 253,300, due to increased demand for Heavy and Tractor-Trailer Truck Drivers. Demand for Installation, Maintenance, and Repair was up 9,700 to 189,200 due to increased demand for General Maintenance and Repair Workers.
Sales and Related occupations fell 23,700 to 602,700, driven by decreased demand for Demonstrators and Product Promoters. Healthcare Practitioners and Technical occupations fell 15,800 to 589,100, led by a decrease in demand for Occupational Therapists, General Internists, and Family and General Practitioners. Business and Financial Operationsoccupations fell 15,700 to 305,900. In the Business and Financial category, the February decrease included lower demand for Tax Preparers. Demand for Food Preparation and Serving-Related occupations dropped 12,100 to 233,400 due to decreased demand for Combined Food Preparation and Serving Workers Including Fast Food (Table C).
Analysis: Professional vs. Services/Production Occupations
While the number of ads is roughly equal between the Professional and Service/Production occupations, the number of unemployed looking for jobs in each category is not. The large number of unemployed pursuing Service/Production openings continues to challenge job-seekers in those fields.
By dividing the HWOL occupational data into two broad categories — Professional occupations and Service/Production occupations — a glaring contrast emerges both in terms of labor supply (i.e. unemployed) and labor demand (i.e. ads). The gap in wages and educational requirements between “white-collar” and “blue-collar” fields is often examined, but less focus has been given to the stark differences in the job-search experience between the two groups.
HWOL uses the Federal government's Standard Occupational Classification (SOC) system codes. The Professional category includes SOC codes 11 through 29, while the Services/Production-Related category is represented by SOC codes 31 through 53. (See Table 7, page 15 for select occupations in each category, including current count of online ads, number of unemployed, and average hourly wage.)
Unemployment and Supply/Demand. The national Supply/Demand rate of 2.4 for all occupations (about 2.4 unemployed for each advertised opening) masks the significant challenges facing job-seekers in the Service/Production occupational categories.
Currently, around 80 percent of the officially unemployed are in Service/Production occupations, with only 20 percent of the officially unemployed in Professional occupations. However, labor demand is split about 50/50 with demand for Professionals making up 51 percent of the ads while demand for Services/Production is at 49 percent of ads. In other words, there is less than one unemployed Professional worker (S/D of 0.83) for each ad, with many occupations in the category feeling a clear shortage of workers. On the other hand, there are close to four unemployed (S/D of 3.7) for every online advertised vacancy in Services/Production with the ratio much higher in a number of the individual occupations. (E.g, Production Works, with 6 unemployed for every job ad.)
“The numbers are clear,” said Shelp. “Even setting aside differences in salaries, savings, and support network, unemployed Service/Production workers are facing a much tougher road back to work than their Professional counterparts.”
Wages and Education. As expected, wages and education contrast sharply in these two occupational groups. Based on the federal government’s average hourly wage data, the Professional occupations show average wages well above $20.00 per hour, ranging from $52 per hour for management to a low of $21 per hour for community and service occupations.
The Service/Production occupations, on the other hand, average well under $20 per hour, ranging from $21 for construction to $10 for food preparation and serving-related occupations. Correspondingly, many of the Professional occupations have a Bachelor’s or Associate’s degree requirement while the Services/Production Related occupations generally range from a "less than high school" to "some college" educational requirement.
In spite of any recent gains, occupations where there are significant job challenges include the following:
- Construction (SOC 47) with 1,127,000 unemployed and an S/D rate of 11.2
- Building/grounds maintenance (SOC 37) with 745,000 unemployed and an S/D rate of 8.4
- Production (SOC 51) with 927,000 and an S/D rate of 6.3
- Personal care and service (SOC 39) with 503,000 unemployed and an S/D rate of 5.5.
Added Shelp, “Given the supply/demand unbalance, there would ideally be opportunities for Service/Production workers to cross over to the Professional openings. In many cases, however, the educational gap will prove to be too great.”

