
North Dakota Has Highest Gallup Good Jobs Rate
Tuesday, February 2nd, 2016
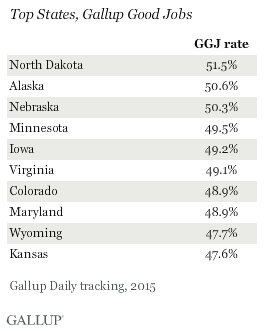
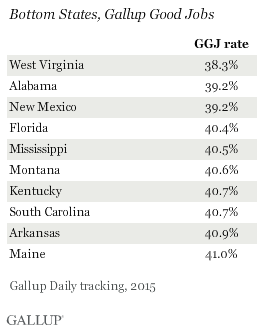
For the third year in a row, North Dakota had the highest Gallup Good Jobs employment rate among the 50 U.S. states, at 51.5%. A cluster of states in the Northern Great Plains and Rocky Mountain regions -- including Nebraska, Minnesota, Kansas, Wyoming, Colorado and Iowa -- all made the top 10 on this measure. West Virginia (38.3%) had the lowest GGJ rate of all the states for the second consecutive year.
Gallup's GGJ metric tracks the percentage of the U.S. adult population aged 18 and older who are employed full time for an employer for at least 30 hours per week. These results are based on Gallup Daily tracking interviews throughout 2015 with 355,270 U.S. adults. Gallup does not count adults who are self-employed, work fewer than 30 hours per week, who are unemployed or are out of the workforce as payroll-employed in the GGJ metric.
The differences in GGJ rates across states may reflect several factors, including the overall employment situation and the population's demographic composition. States with large older and retired populations, for example, would have a lower percentage of adults working full time. Several of the states with the lowest GGJ in 2015, West Virginia, New Mexico and Florida, have some of the largest proportions of residents aged 65 and older (21.2%, 20.7% and 21.5%, respectively). Regardless of the underlying reason, however, the GGJ rate provides one perspective on a state's economic vitality.
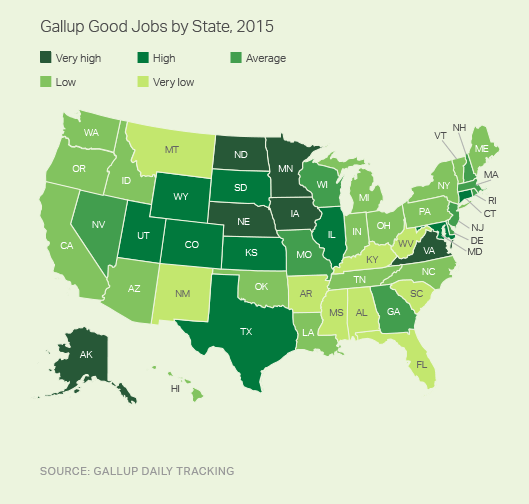
Aside from the Mountain and Plains states, states bordering the nation's capital and in the Northeast also showed higher levels of full-time employment for an employer. Washington, D.C.'s, GGJ rate of 57% exceeded that of any of the 50 states. Washington's higher GGJ rate may result from it being a solely urban location and one heavily dominated by the presence of the federal government as well as having a low percentage of residents aged 65 and older (13.7%).
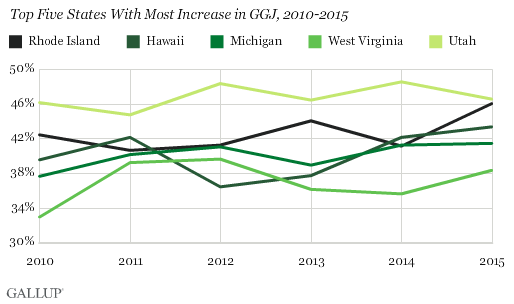
Despite many of the same states appearing in the top or bottom ranks for GGJ and unemployment year to year, some have shown solid improvement. Rhode Island showed the strongest improvement in GGJ, rising from 42.4% in 2010 to 46.0% in 2015. West Virginia, consistently the state with the lowest GGJ rate, also showed strong though uneven improvement over this period, rising from 32.9% in 2010 to 39.6% in 2012 before settling at 38.3% in 2015.
South Dakota, Iowa Had Lowest Underemployment Rates
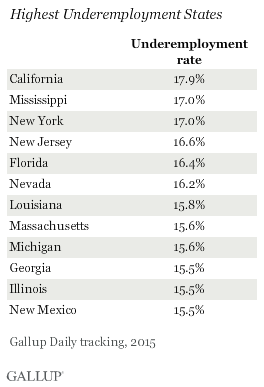
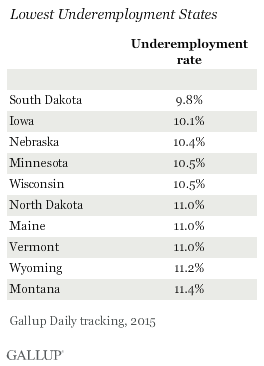
As with GGJ rates, states in the Northern Great Plains and Rocky Mountain regions -- including North and South Dakota, Nebraska, Iowa, Wyoming, Montana, Wisconsin and Minnesota -- were among those with the lowest underemployment rates in 2015. California had the highest underemployment, at 17.9%, though this is down from the rate measured in 2014 (19.6%).
Gallup's U.S. underemployment rate is the percentage of adults in the workforce who are not employed but are looking and available for employment or who are working part time but desire full-time work. While GGJ reflects the proportion of adults working full time for an employer relative to the entire population, Gallup reports the underemployment rate as a proportion of adults in the workforce -- all those working or seeking work.
GGJ and underemployment are both objective indicators of the employment situation, and as such, there is a great deal of overlap on these two metrics among the best- and worst-performing states. The measures also correspond with the several of the best and worst performers on Gallup's Job Creation Index, which provides a more attitudinal assessment of the state's economic and employment picture. North Dakota is in the top 10 and West Virginia in the bottom 10 on the 2015 state lists for Job Creation Index.
However, these metrics do not always track together. While Alaska ranks at the bottom for Job Creation Index in 2015, the state's employment situation is relatively strong according to Gallup's GGJ and underemployment metrics. And while Florida had the fourth-lowest state GGJ rate in 2015, it was tied for 10th-highest state Job Creation Index. Ultimately, while GGJ, underemployment and the Job Creation Index all describe aspects of the labor market, they are measuring different aspects. In particular, the Job Creation Index measures perceptions about hiring activity and intentions within businesses, while GGJ and underemployment measure the current employment status among the population and within the labor force.
Bottom Line
The most robust labor markets in the U.S. continue to center around the northern Great Plains states and the nation's capital, with consistently high rates of full-time employment for an employer and relatively low underemployment.
Underemployment remains a more serious problem for states on the coasts -- California, New York, New Jersey and Florida -- than for those in the interior of the country. However, full-time employment for an employer continues to lag behind in many areas of the country despite other signs of stronger labor demand.

